
Coenraad Janse van Rensburg, Data Scientist
Theuns van Wyk, Soil Scientist
Marnus Ferreira, Head of Soil Science
Unlock the potential of your soil
Agri Technovation measures the value of soil classification and fertility as well as the influence of the soil physical and -chemical properties on crop yield. Soil classification drives informed cultivation and management practices, but such cultivation and management in itself do not exploit the full potential of the soil.
To unlock the soil’s full potential, Agri Technovation uses different data layers.
Data mining and analytics go hand in hand in data driven processes. Generally, data mining refers to the analysis of big data for the purpose of discovering and extracting patterns or trends within the data. In contrast, data analytics is the combination of systematic, logical and statistical techniques to gain meaningful insights to make informed decisions accordingly.
The key difference between data mining and data analytics is that data mining provides data patterns or trends, while data analytics provides verified hypotheses or insights based on already-available data.
It is now possible for the grain producer to enjoy the benefits of data mining and analytics and to derive the maximum potential from the soil, with the assistance of data-driven services, such as the MYDATA MINING™ service offered by Agri Technovation.
What data is mined?
Only entity-specific data is used, where entity refers to the single client to whom the service is provided. Hence, regional data or general sample data is not utilised, and the outcomes are therefore exclusively applicable to the specific client.
The yield data of yield maps are used at point level as dependent variable and evaluated against various independent variables to identify patterns and draw inferences. Independent variables can be evaluated to identify high-yield drivers per block/farm. This allows the analyst to identify interactions that may not be obvious, and/or to confirm suspicions from an unbiased perspective. Data analytics in this context helps agronomists to make precision recommendations with more certainty.
The uniqueness of each entity (client) means unique variation in each case that needs to be explained, in order to make precision recommendations.
How is the data applied?
Informed varying planter- and fertiliser maps
During the data analytics process, the main drivers within the soil’s physical and chemical properties are determined. Variable maps are then produced according to those main drivers. For example, a land consists of mainly Hutton soils, but inside the Huttons certain areas produce less or more yield. Those drivers that affect production are easily identified by looking at the big data. If the driver is a problem that can be addressed easily, such as through liming or tillage, then the uneven yield can be evened out. However, if it is something inherent to the soil such as depth or stone fraction, then the opportunity exists to draw up a varying map that takes into account the potential of the soil.
Meaningful contributions to management practices
Data analytics further enables Agri Technovation experts to identify the unique critical factors that will drive crop yield on every field. This will help the producer to focus efforts where most required and to make more meaningful contributions to the applied management practices and ultimately, to improve crop yield.
Cultivar selection
With data mining the performance of a cultivar per country or per farm can be determined, accompanied by the ideal stand for each unique microclimate. The data mining process is done independently of any other organisation (i.e., entity-specific) and provides clear visual data. It is recommended that this process be done with the chosen management team and suppliers in order to gain the maximum benefit.
Data Mining: Examples
Graph 1 represents depth for potential root development versus crop yield for a single entity, focussed on white maize in the North-West area. This environment was specifically chosen as example as the area is generally regarded as having homogeneous soils with no or little variation. Graph 1 clearly illustrates the remarkable variation in soil forms as well as yield difference between the 12 soil types. Furthermore, the impact of depth for potential root development on crop yield can also clearly be observed.
Agri Technovation performs data analytics on all the different characteristics measured during the soil classification process. Each additional variable gives more context and a better (more refined) explanation for why yield differs, as well as of what could be done to maximise yield and/or minimise input costs.
Graph 2 is an example of yellow maize yields in the Highveld in a field where more than 80% of the area consists of a single soil type. Yield variation is however observed within this single soil type. With the use of data mining, it becomes clear that in this case, the main driver can directly be linked to depth for potential root development.
The opportunity now exists to apply input costs varyingly according to soil depth, which inherently drives the yield. This phenomenon is linked to the specific crop of interest. It is clear that different crops react differently to the physical and/or chemical variation in the soil.
Graph 3 shows a soya bean yield trend in the Eastern Free State. This was done for the entire farm using the 3 main soil types. The graph shows the yield versus the underground clay% (B horizon). There is a clear trend in the data indicating that (in this case) yield increases from 5% – 25% subsoil clay and starts to decline where the clay % increases to 45%; information that is immensely valuable to the producer.
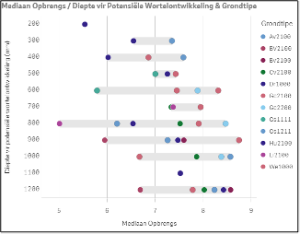
Graph 1: Median white maize yield over more than 850 000 data points for 4 farms during 2021 and 2022

Graph 2: Yellow maize yield versus the depth of the main soil family – Clovelly. In a case (such as this one) where more than 80% of a field consists of one soil type (which rarely happens), there is still variation within the soil’s physical/chemical properties that can be utilised via varying application of input costs.

Graph 3: Soya bean yield versus subsoil (B horizon) clay % on farm B. Note the trend (green line) increase in yield from 5% to about 25% (red dotted line represents the average turnaround point), and then the reduction in yield
with further increase in clay% to 45%. The data was done for the 3 main soil types on the farm. Each colour represents a unique ground form, as indicated in the legend.
Conclusion
Agri Technovation creates a link between soil physical and soil chemical properties and crop yield, using the MY SOIL CLASSIFICATION™ and ITEST™SOIL services, and then combining them with yield maps through data mining and analytics (MYDATA MINING™).
From the data it is clear that soil physical properties have a significant impact on crop yield, and also that they can vary within a given area.
Each farm is unique in terms of the soils that are present and how they perform. The principle remains that soil physical properties form the foundation of each farm and must be managed accordingly to achieve optimal yields.
By using Agri Technovation’s MYDATA MINING™ service, producers can gain insights into which crops or cultivars are most productive in a particular soil type and climate. Data from this service can then be used to optimise crop production, reduce unnecessary expenses and risks and improve overall efficiency, leading to increased profits and sustainable farming practices.
What is required for the data mining service
- Soil classification data.
- Soil-chemical data.
- Yield maps.
Why is it so powerful?
- Agronomic factors drive plant production, such as soil-physical and -chemical (fertility) characteristics.
- The power lies in the ability to analyse large volumes of data at the touch of a button.
- We use this to understand which limiting factors have the greatest influence on production and where they are present.
- An action plan is developed to remove/reduce the limiting factors.
- Input costs are optimally utilised: Long-term data indicates an average saving of 16%.
- Consequently, production potential and/or profits increase


