
By Marnus Ferreira
Head of Soil Sciences
Agri Technovation
This article aims to better explain the intricacies of how soils behave under irrigation in a scientific yet practical way. Due to the massive variation in soil types that exists in areas of Southern Africa, we experience variation in irrigated fruiting crop performance.
To better expand on this topic, two aspects of soil classification and irrigation will be focused on: soil water content and soil types. More importantly, the focus will also be on how these aspects interact – because, by understanding the how, it enables us to provide solutions to fruit farmers worldwide.
Here is a scenario: You plant an orchard of fruiting trees. They all receive the same amount of water, the same sunlight, the same rainfall and the same fertilizer. Yet, some areas of the orchard perform poorly.
This is often due to variation in soil type and/ or other soil physical properties. We know that certain crops and rootstocks prefer specific soils and will perform optimally if planted there, and vice versa: will perform badly if planted in poorly suited conditions. But why does this occur? Why does variation in soil physical properties lead to growth issues?
To explain this occurrence, we are going to use the soil water balance equation: Soil water balance: ΔS = P – D – RO – ET
ΔS: Change in soil water content
P: Precipitation
D: Drainage
RO: Run-off
ET: Evapotranspiration
Let’s say for argument’s sake, that in a 20ha block the following variables are relatively constant:
• precipitation (rainfall);
• evapotranspiration; and
• run-off (if using drip irrigation).

Figure 1: Bar graph showing the proportion of soil moisture content for three different soil textures, namely sand, loam and silty clay loam. Note the different levels of soil moisture – saturation, field capacity and wilting point for each texture. Water in soil is given in mm/m of soil. Therefore, the variables that are directly related to the soil type would be drainage (and of course how much water it can store). That is already one vital factor to consider. Knowing
how fast and how effectively a soil drains, is key to understanding how much water is required and when to irrigate in order to arrive at optimal soil moisture. Figure 1 exhibits this phenomenon quite nicely. In this example, we are looking at how soil moisture levels change with texture.
Let’s use loam as an example (Figure 1). If we were to irrigate a loam soil from being bone dry, it would take 440mm of water per m of soil to completely saturate. Of course, we don’t want to saturate the soil for long periods due to the fact that crops cannot effectively use any of that water as soils that are too wet, negatively impact transpiration.
Trees require a favorable ratio of air and water to function optimally. That ratio is only reached once the saturated water has drained sufficiently to reach Field Capacity (FC) (where blue transitions to green). This is where we want the soil water/moisture level to be for optimal growth. The light green section of the plant available segment represents roughly 50% of the total Plant Available Water (PAW) portion of the graph. This is the area we want to stay in when irrigating, as the plant can absorb water without undergoing stress.
Once the soil moisture drops below that level (and that level does differ between crops)
the plant undergoes some level of stress to successfully extract water from the soil. Remember, soil particles (especially clay minerals) exert a strong force that holds onto soil water. Only during the optimal range of PAW does the plant readily remove water from the soil. Once we reach the wilting point, the plant cannot extract any more water from the soil – even though a significant amount of water remains, it is too tightly adsorbed to the surrounding soil particles to be used by the plant.
This area is the unavailable portion of the soil water graph (Figure 1).
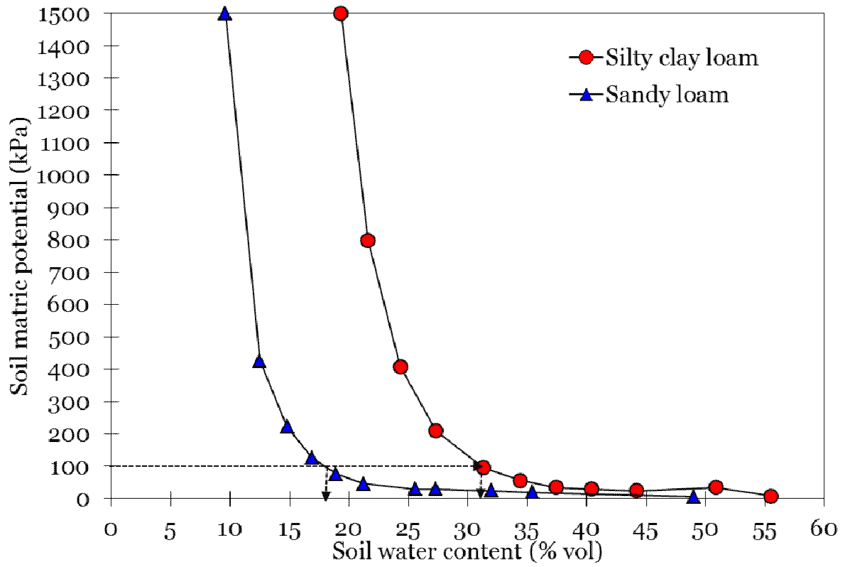
Figure 2: Comparison of soil water content (% volume) for a sandy loam (blue triangle) and silty clay loam (red circle) versus soil matric potential (kPa). Note that both reach 100kPa at very different soil water contents, indicating that the soil water content for these two textures should be managed differently to maintain optimal soil moisture content. From Ley et al., 1994.
Sand, for example, has a very large, saturated portion on the graph (Figure 1), but only about 80mm of PAW per m of soil, which is a small fraction of the PAW. That is why it is so difficult to maintain optimal soil moisture levels in sandy soils during hot weather conditions. In these conditions, it is very easy to over irrigate. The saving grace normally is the rapid drainage involved with most sandy soils.
Another example, as shown below in Figure 2, is the difference in soil water (or matrix) potential between sandy loam and a silty clay loam soil. The soil water potential is a direct measurement of water availability to the tree and is measured in kPa. In other words, how hard the plant has to work to remove moisture from the soil. The cut-off for PAW in this scenario is 100kPa – in other words, wilting point is reached at 100kPa. Water below that is considered plant available (the green portion of Figure 1) and above 100kPa is not plant available (the red portion of Figure 1). It is a different view of the same scenario stated in Figure 1. In this instance, roughly of 17% soil water content remains in a sandy loam and yet it is no longer plant available.
For a silty clay loam, the soil water content has to reach roughly 32% before the remaining
water is no longer plant available. Clearly, we expect variation in terms of the amount of water the soil can store and the amount of water required to replenish our soils back to FC. To further complicate things, not only do we have variation in soil texture in our orchards, but we also have variation in soil type. Soil type refers to the physical characteristics that define our soils according to the taxonomic system used by a specific country. The soil physical properties collected leads to the identification of a soil and a name is given, such as an Avalon, Valsrivier or Hutton.
These soils are fundamentally different due to their dissimilar formational parameters:
• Parent rock
• Aspect
• Topography
• Biotic influences
• Time
The difference between these soils is often stark, but for the purpose of this article, we focus simply on one area – drainage. This goes back to the soil water balance equation, ΔS = P – D – RO – ET. In this scenario, we assume all the other variables to the right of the equal sign, are constant. If the soil’s ability to drain changes, then our soil water content will change at varying rates, which means we might reach the optimum level of PAW (the light green section) sooner for one soil than we would for another. Also, assuming we irrigate to FC, the time it would take for a Hutton, which is an extremely well-drained soil, to reach the bottom of the barrel so to speak, would differ from what it would take for say an Avalon, which drains slower and has a fluctuating water table in the subsoil.
Valsrivier would have a totally different soil water drainage profile than either the Avalon or Hutton due to its clayey subsoil. That is why it is vital to group all your similar soil types together into separate irrigation blocks, and to place moisture monitoring probes on soils that represent the irrigation area. Otherwise, you might end up irrigating according to a probe/tensiometer that has been placed on a soil that does not give a true reflection of your orchard/block.
Another example would be a shallow soil with a subsoil clay pan. It would drain significantly slower than the adjacent soil which has more depth. Therefore, their irrigation cycles would not complement both soils.
Fruit tree crops are susceptible to damages due to poor aeration, waterlogging, salinity
and root diseases. Due to the natural soil variation found in farmed areas and the resulting differences in how those soils behave under irrigation, it is imperative to map out those areas and group soils that will behave similarly to achieve optimal growth and yield. Areas that are especially prone to causing problems are:
• “Wet spots”;
• Rising water tables;
• Surface water at seep lines on lower slopes;
• Abrupt textural change, such as sand on clay; or
• Where shallow bedrock or hardpans or high clay content occurs.
To avoid such scenarios, we recommend performing soil classification on all new developments to get an idea of the required soil preparation, orchard layout, soil zones and general management practices to achieve long-term success.
Existing orchards should also be classified to better understand how irrigation can be adjusted moving forward and what interventions could be made such as drainage and surface water management.


