
Written by Erald Smith, Head of Services at Agri Technovation
“Great things are done by a series of small things brought together.” – Vincent Van Gough. Paraphrased to bring these wise words closer to home: “Great harvests are achieved by doing a series of small things right throughout the season”. Some key practical questions flow from this philosophy in how do we identify those small things and where do we find them?
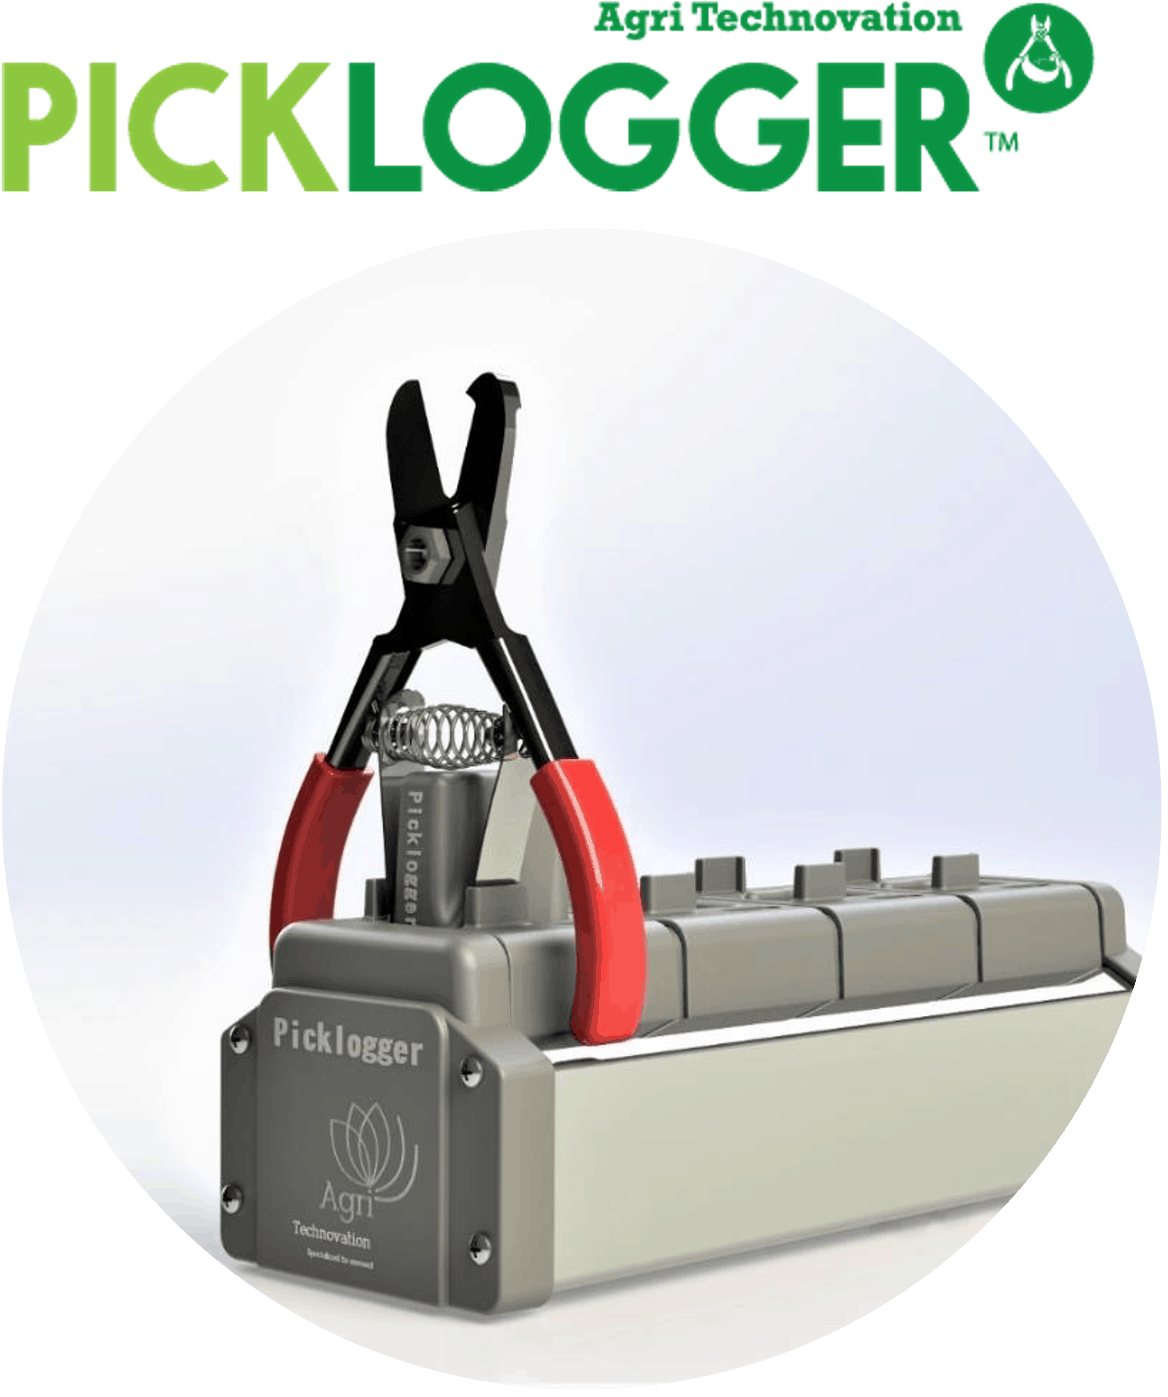
Agri Technovation’s innovative harvesting tool, Picklogger™, aims to answer both questions by bringing a new level of precision data to perennial crops.
Current view of an orchard
Currently farmers look at an orchard from an absolute average perspective with data provided from the packhouse and other harvest monitoring systems. In other words, we get a value of x ton/ha for orchard A and y ton/ha for orchard B. If the crop, cultivar, age of trees and climatical conditions are the same, we can do a comparison to check performance on orchard level.
The Picklogger™ innovation, enables a completely different view of the orchard by giving farmers the ability to produce yield maps for fruit crops. Picklogger™ logs a GPS point for every fruit picked and by combining this information with a weight parameter from a scale or packhouse input produces a yield map that identifies variability on an almost per tree basis (Figure 1). Comparing these yield maps with other sources of information like soil chemical analysis, soil physical properties, pest data, weather data, irrigation practices, etc. brings forth new insights in the performance of your orchards on a much deeper level than was possible before. All these datasets and comparisons are made available through the innovative MyFarmWeb™ platform (Figure 2).
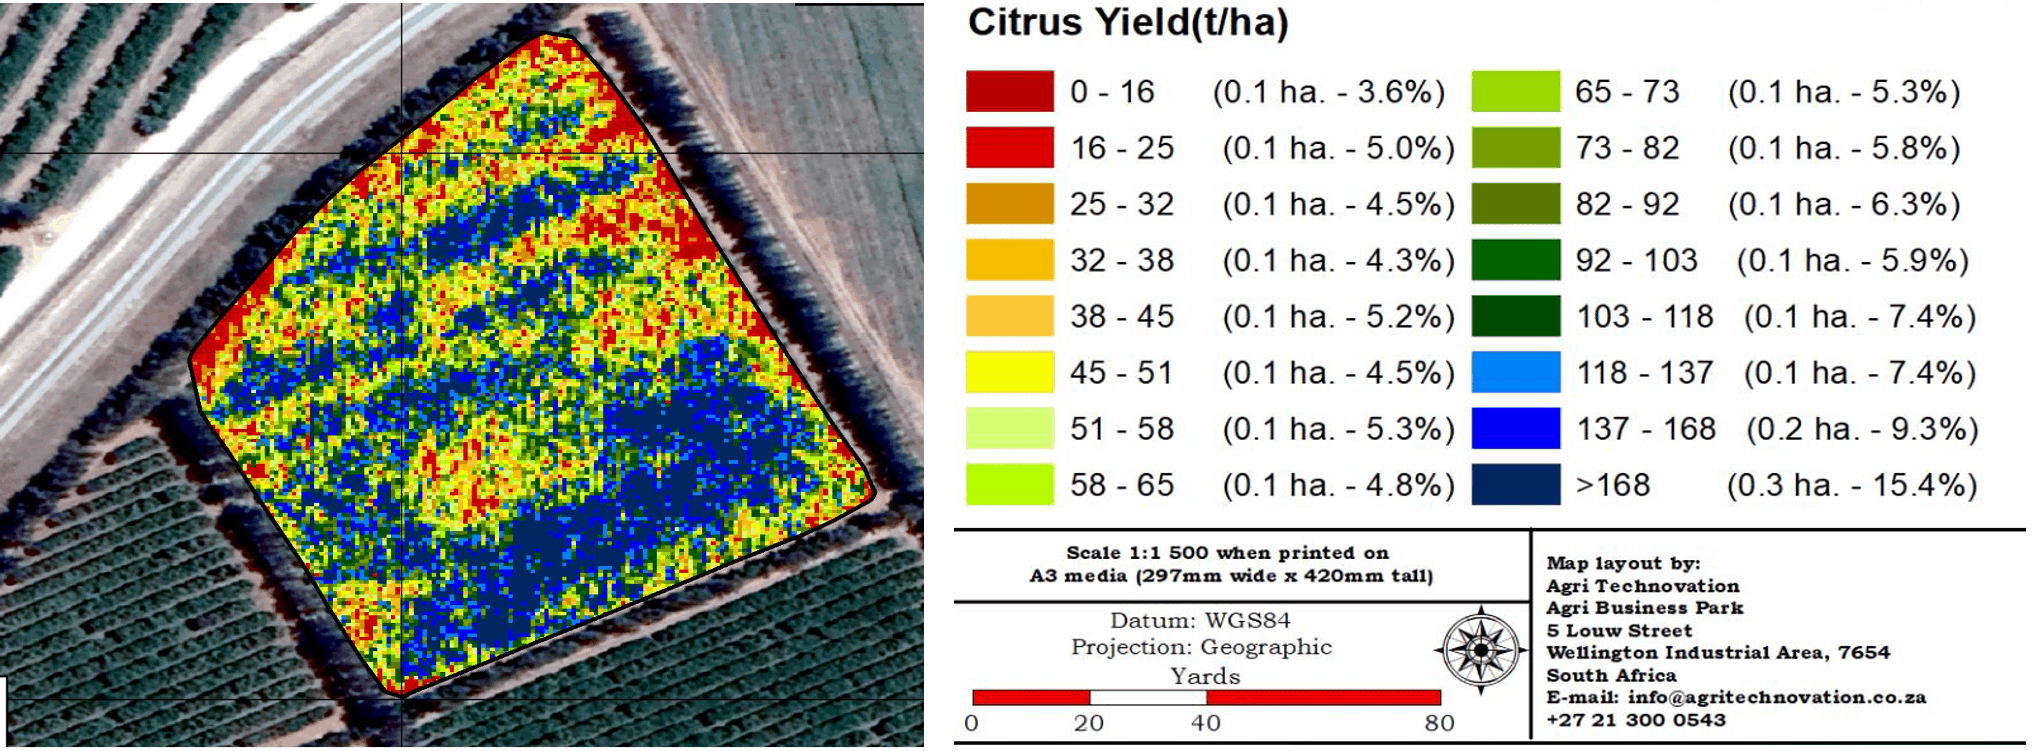
Figure 1: Citrus yield map with diverse variability within the orchard
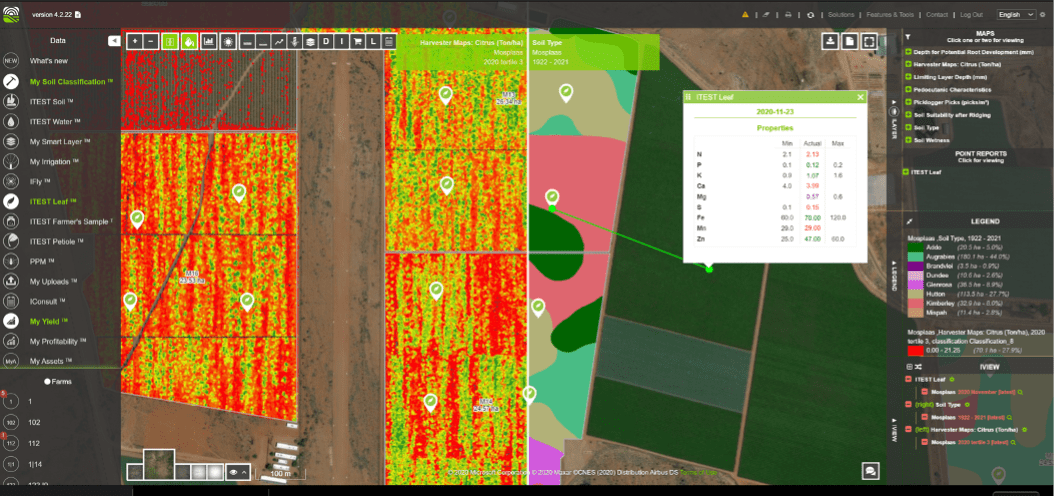
Figure 2: Combining the Picklogger™ yield maps with other datasets in MyFarmWeb™
A world of opportunities with Picklogger™
Over and above producing accurate yield maps, the enhanced level of in field data measurements also opens opportunities for a variety of other insights. An enhanced RFID integration package that marries each pick to a crate or bin used in the harvesting process allows Picklogger™ to integrate with packhouse systems and produces employee efficiencies statistics and indicators that can be used in season for employee productivity enhancements.
Integration with modern packhouse systems also enables further traceability from the fruit on the retailer shelf right down to an almost per tree basis. Currently the traceability detail stops at orchard level, but Picklogger™ can overcome that “last bridge” that connects the fruit on the retailer shelf to the tree in the orchard where the fruit was produced.
In closing
Currently Picklogger™’s harvesting capabilities include most fruit that are harvested with a shear, scissor or pruner and includes like citrus, avocados, table grapes, pome fruit, stone fruit, and mangoes. Furthermore, Picklogger™ is also in the process of exploring yield map capabilities for vegetables like onions and peppers.
Most farmers intuitively know the lower and higher performing areas in their orchards just by spending time in orchards season in and season out. Using the detailed yield maps produced by Picklogger™, farmers can now truly quantify that variability, identify where they are and adjust their farming strategies. As a start, focus on what can be done to the lower and average performing areas, and through that, do a series of small things that produces an even higher yield.
With more than 70 million fruit picks logged in the 2020 harvesting season, be sure to include Picklogger™ as a tool to ensure future long-term success and sustainability on farm level!


