Build your own soil puzzle and unearth the soil’s full potential
by Schalk du Plessis, Senior Soil Scientist and Coenraad Janse van Rensburg, Data Scientist
Unlock the full soil potential
The ITEST™SOIL and MYSOIL CLASSIFICATION™ services have made it possible for many a producer to firstly identify variation in soil and then to apply informed management practices in accordance with such variation. In addition to the correct identification and management of these varying soil properties, producers also experienced an increase in overall crop production and profitability at farm level.
Although the value add to producers is already significant, this is not where it stops. Additional methods are available, the application of which making it possible for producers to exploit the full potential (thus more value add) of the soil.
By integrating harvester maps and PICKLOGGER™ yield maps with the above-mentioned precision services, the basic precision principles can be elevated to a whole new level. By combining perennial yield map data with soil physical and soil chemical data, a new world of information is unlocked. The study of crop yield responses to soil properties enables the adjustment, refinement and improvement of management practices at farm level. This further improvement is made possible with the MYDATA MINING™ service offered by Agri Technovation.
Soil potential as a jigsaw puzzle
Soil potential can be compared to a puzzle where each puzzle piece represents a soil property that affects crop production. To build the puzzle it would of course be very important to have all the pieces in hand. However, the full picture can only be revealed once each of the pieces has been rotated and assembled correctly. The correct assembling of each puzzle piece symbolises how each specific soil property should be managed. It is only when all these properties are managed correctly, that the soil can perform optimally, creating the perfect picture.
Gathering and correct assembling of puzzle pieces
Winning combination: Soil precision services and data analysis
A significant number of soil puzzle pieces are identified through the MYSOIL CLASSIFICATION™ and ITEST™SOIL services. MYSOIL CLASSIFICATION™ identifies the variation in soil physical properties such as texture, potential root depth, limiting layers, and others. Use of this information drives informed cultivation and management practices. ITEST™SOIL identifies variation in soil chemical properties, which makes it possible to manage the soil nutrient status (such as pH levels) and soil properties from chemical origin (such as compaction and hard setting of soil) correctly.
By taking this soil precision data and combining it with the MYDATA MINING™ service, it is possible to determine exactly how the puzzle should be built. MYDATA MINING™ involves the use of yield data (obtained from harvester maps) and the evaluation thereof against various precision variables for the purpose of identifying patterns and drawing inferences.
The above combination makes it possible to identify interactions that may not necessarily be obvious, and/or to confirm presumptions from an unbiased (objective) perspective. To the producer this means more effective decision-making and precision recommendations for improved agricultural production.
Success achieved by Agri Technovation in Western Australia on small grains
By applying MYDATA MINING™ to MYSOIL CLASSIFICATION™ data collected on a farm near Brookton, Western Australia during 2020, it was possible to identify the three main limiting factors impacting root growth and yield, namely (1) high clay content and anaerobic conditions, (2) compaction and (3) high volume stone fraction (Figure 1).
The correct management of these limiting factors involved the following:
- installation of drainage (in areas where clay and wetness were limiting factors); and
- tillage with a ripper plough (in areas where compaction and high stone fraction were limiting factors).
After the implementation of these informed management practices, canola yields from these areas improved by 0.6t/ha (Figures 2 and 3).
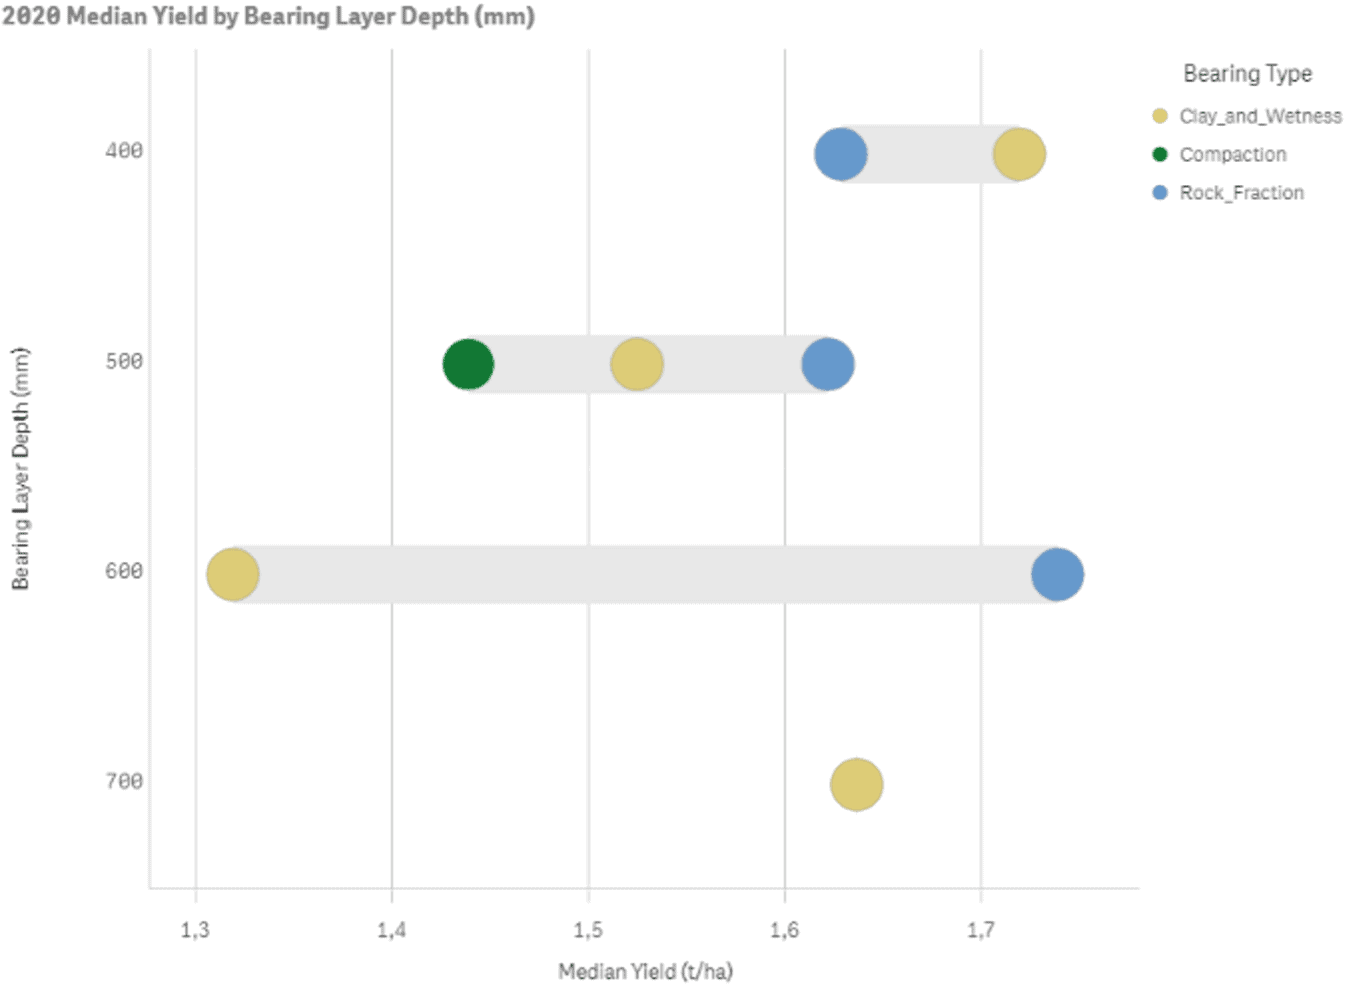
Figure 1: The average canola yield (t/ha) in 2020 for each limiting layer at the depth at which it was identified.
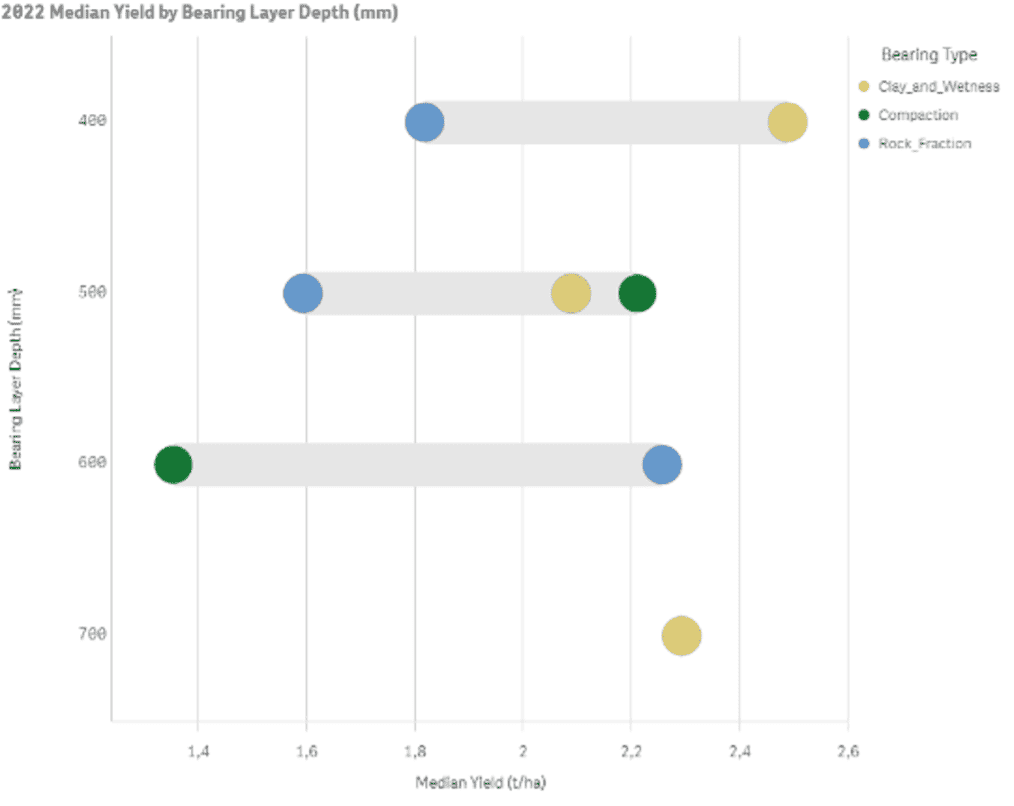
Figure 2: The average canola yield (t/ha) in 2022 for each limiting layer at the depth at which it was identified.
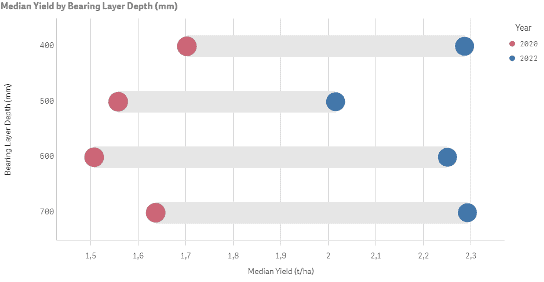
Figure 3: The average canola yield improvement (t/ha) from 2020 to 2022 after soil improvements (informed decision-making).
Further data mining using the same producer’s ITEST™SOIL results showed that the best canola yield was achieved in areas where P-Bray 1-phosphate levels in the soil were between 25 mg/kg and 30 mg/kg (Figure 4).
After discovering this valuable data, it was possible to confirm with certainty that additional fertilisation on areas with soil P-values higher than 30 mg/kg would not result in any yield improvement. Through this farm-specific data mining, the fertilisation programmes could be adjusted to avoid unnecessary costs and antagonistic reactions caused by over-fertilisation.
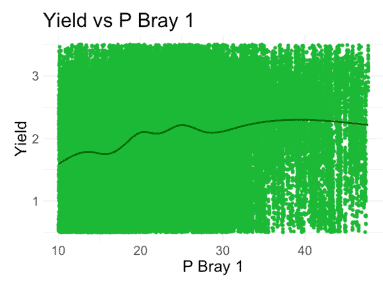
Figure 4: Yield versus P Bray 1 phosphate levels on the Western Australian farm. Data points are indicated in green and the average reaction in black.
Data mining can also be used to gain a better understanding of the interaction of soil physical and soil chemical properties on crop yield and therefore, the correct management thereof. In this instance the Ca:Mg ratio in the soils from the same farm in Western Australia serves as example. In soil the Ca:Mg ratio is commonly used as an indication of the stability of the soil structure. This trend is illustrated in Figure 5, again with the use of Western Australian farm data.
Soils with a clay content of 1% in the A horizon benefit more from the presence of higher Mg levels than from higher Ca:Mg ratios. Therefore, a decrease in canola yield is noted, as the Ca:Mg ratio increases (left).
In contrast, Canola in soils with a higher clay content of 25% in the A horizon benefits more from the improvement in the Ca:Mg ratio, which in turn leads to an improvement in aeration and water penetration in the higher clay-containing soils (right).
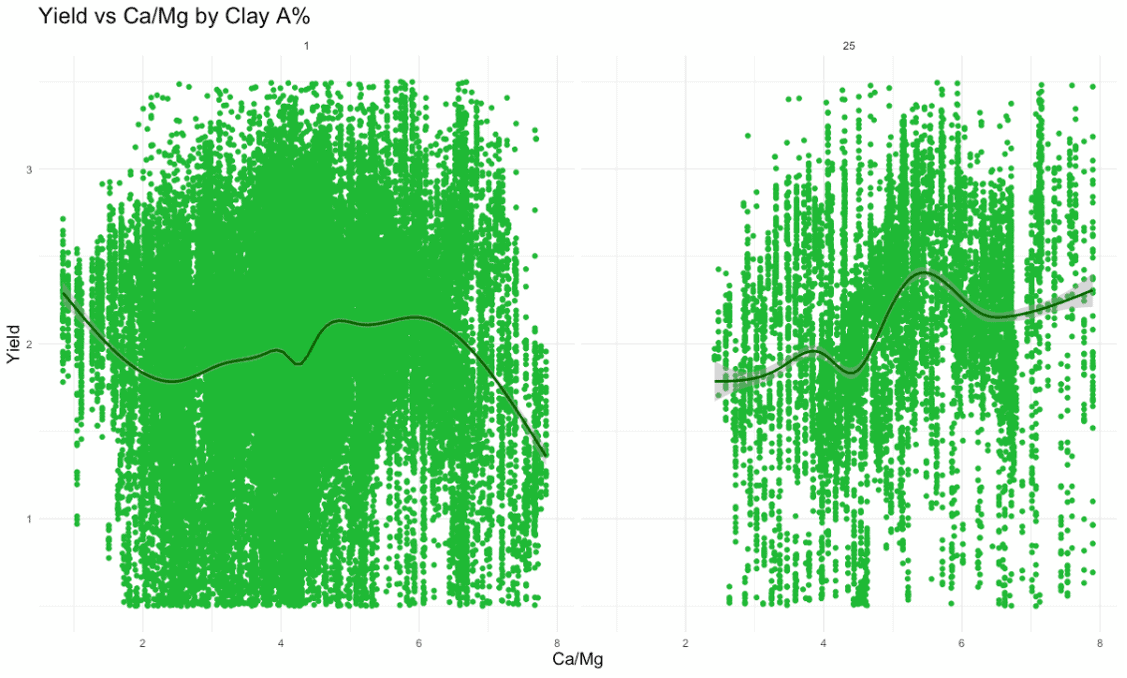
Figure 5: The impact of Ca:Mg on canola yield in a sandy soil with 1% clay (left) and a loamy soil with 25% clay (right). Data points are indicated in green and the average reaction in black.
Summary
Data mining through MYDATA MINING™ in combination with MYSOIL CLASSIFICATION™, ITEST™SOIL and yield map data makes it possible to unearth and reveal more detailed and refined insights regarding the response of soils to applied practices, and as to how yield can be improved. There is also the further prospect of integrating the data mining already performed on biological components of the soil with the chemical and physical components, thereby developing deeper insights regarding the holistic management of soil.
By gathering all the puzzle pieces and then placing each piece correctly, the full picture becomes clear, making it possible to exploit the full potential of the soil according to the picture displayed. With the prospect of attaining these benefits, each producer should build a soil puzzle and unlock the full value.
